
Clinical
Division of Endocrinology & Metabolism
CLINICAL ACTIVITIES
Endocrinology faculty members (l-r) Ralf Nass, MD, Jennifer Kirby, MD, and Cherie Chaney, NP.
Expansion of Clinical Services
The Division of Endocrinology continues to expand its geographic reach, opening new clinics or expanding existing ones to the north, east and west of Charlottesville during FY 2015. These include: UVA Primary Care Madison to the north; UVA Family Medicine and Specialty Care Crozet, to the west; UVA Specialty Care Pinnacle Drive, in the Shenandoah Valley (Augusta County); and, to the east, UVA Primary and Specialty Care Zion Crossroads. A broad range of endocrine-related diseases are treated at all these locations, including diabetes, osteoporosis, and disorders of the thyroid, adrenal, pituitary and reproductive glands. Expanding services to these locations allows the division to better serve its patients in their home communities.
Foundation of Diabetes Care: Educating Patients, Teaching Self-Management
The services offered in the division’s outpatient clinics provide multifaceted, patient-centered care for those with diabetes. Whether the diagnosis is Type 1 or Type 2 diabetes mellitus, the foundation for good care is thorough education about how to effectively self-manage the disease.

UVA Family Medicine and Specialty Care Crozet
The Virginia Center for Diabetes Professional Education provides tele-education sessions, including medication administration education, the role of stress on diabetes, effective glucose management and nutrition counseling. These sessions are provided free of charge to our patients and physicians alike.
At UVA Hospital, the division’s Inpatient Glucose Management Team, created in FY 2014, continues to serve post-operative patients who have undergone cardiovascular surgery; the implementation of this service has resulted in significantly improved outcomes for these patients, as illustrated in the figure below.
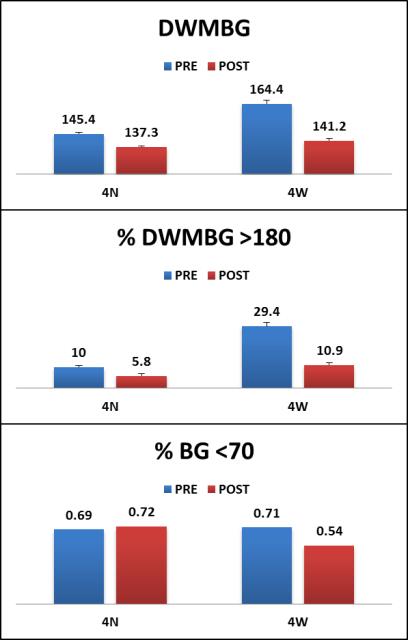
Figure: Comparison of glycemic data for cardiac surgery patients in the ICU (4N) and in acute care (4W). Blue bars denote data obtained over 12 months in the pre-intervention period, while red bars denote data obtained over 12 months post-intervention (implementation of the Inpatient Glucose Management Program consult service and Glucommander®). Error bars represent standard error of the mean. The top panel represents the average patient day-weighted mean blood glucose in mg/dL. The middle panel represents the percentage of patient day-weighted means that were above 180 mg/dL. The bottom panel represents the percentage of all blood glucoses that were less than 70 mg/dL. DWMBG: day-weighted mean blood glucose.